You created that content, you posted it on social channels, you crossed your fingers, lit a candle and said a prayer – is it actually working? Check your analytics!
How do you know which data points to look at? Not all metrics are created equal and it’s important to know which ones are the most important. In this episode, Chris Casale and Ryan Smith walk through the different ways to use Analytics to measure how your content is performing.
Podcast highlights:
Ryan Smith: [00:02:40] In this episode, as we said, we’re going to explore the various content marketing metrics in Google Analytics. Some of it might be new to you. Some of it it’s you’re aware of it, but you overlook it and you’ll discover how you’ll make marketing decisions based off of the data in front of you.
Chris Casale: [00:02:58] So this podcast is actually the third in a series of podcast episodes we’ve created over the last few weeks. Two weeks ago, we talked to you about how to determine what the right content was to build right for it for each stage in the marketing funnel. Last week we focused on how do you repurpose that content? You’ve put a lot of time and energy into building it. How do you repurpose it and use it across different platforms?
Well, today we’re gonna talk to you about the analytics side of things. How do you measure which content’s performing? So (analytics) it’ll give you ideas that you can, you know, build more content with, but also other ways that you might be able to leverage the content you’ve got that’s very, very successful. In order to do that, we’re going to talk to you about a couple platforms.
First of all, we’re gonna start with Google Analytics, because that is the basis for analytics measurement in the marketing world.
Content Marketing Analytics
Here 4 of the more popular metrics to gauge how users engage with your content:
- Page Views
- Bounce rate
- Time on Site
- Goals
Ryan Smith: [00:04:23] First thing we like to look at when you’re creating content. So if it’s on your website, obviously, that’s where Google Analytics comes in. If you’re creating articles, if you even have sales pages, if you just want to see where people are navigating to on your website.
This is one of the things that we love about Google Analytics. So specifically to the content that you are creating and publishing on your website, there’s a couple that you need to look at. First and foremost is what are the actual pages that your users are viewing when they come to your website? The metric is page views.
Couple of things that people naturally like to look at. They’re going to look at the bounce rates meaning they didn’t advance to another page. They landed on that page and they didn’t advance another page and they left your website.
Technically as a high-level overview that’s what a bounce rate is. Now, a lot of people put a lot of weight and emphasis on bounce rate. High bounce rates mean very bad content. And that’s a misnomer. And that’s not a hundred percent accurate. It can’t be accurate, but that’s not 100 percent true.
Google states, “Is a high bounce rate a bad thing?
It depends.
If the success of your site depends on users viewing more than one page, then, yes, a high bounce rate is bad. For example, if your home page is the gateway to the rest of your site (e.g., news articles, product pages, your checkout process) and a high percentage of users are viewing only your home page, then you don’t want a high bounce rate.
On the other hand, if you have a single-page site like a blog, or offer other types of content for which single-page sessions are expected, then a high bounce rate is perfectly normal.”
Google Analytics Events
Google says, ‘events are not tied to any specific pages and can occur at multiple times per session. In addition, Events do not allow you to see conversion data such as conversion rate.
Also, you cannot access Events in standard reports under Goals and Conversions.
To access Event insights you can reference the Behavior report in Google Analytics.’
Ryan Smith: [00:25:35] So events…you have events and then you have goals. Goals, for example, are things for somebody does an action like they filled out a form. And that form, obviously, in a sense, could be a Contact Us.
You can create a goal around. It could be a lead magnet where they download a guide and then you create that goal. Events, on the other hand, are not tied to any specific pages. You get one goal during a session. You can have a person trigger multiple events during a session while you’re on your Web site.
Events don’t allow you to see conversion data such as like a conversion rates. And you can’t access events in your standard reports under goals and conversions. So to access events, you can reference their behavior. Reports in Google Analytics was on that left sidebar.
So one thing you can do is you create events in Google tag manager and something that is going to trigger an event. One way, specifically, content marketing or videos. You can create an event when somebody scrolls your page and you can create it, whether it’s twenty five percent down 50 percent, down 75 percent down this scroll your page or 100 percent.
So hypothetically, you can have an event trigger and find out on the pages on your Web site that somebody scrolls 75 percent down. They scroll one hundred percent down. This is great for blogs and articles. Also, if you have a sales page and you’ve probably seen it, some sales pages of shorts, some sales pages are extremely long where you have to scroll and scroll and scroll and. Now there’s theories of why those are super long, because I figure if you’re going to go down this bar, you’re probably very close to buying or you are more likely to buy that product.
Scroll page depth. How far down they go in those percentages gives you an idea at what point people are dropping off. What’s your content there. Were you super repetitive and they just got sick of it? Articles. Same way. Super long articles that say you have this pillared blog post that is two thousand twenty five hundred words. You can find out how far down did people go before they bailed?
You can see did somebody maybe they only spent fifteen seconds on a blog post, but they completed they made it all the way down. What does that tell you? They were skimming. So you can look at your blog content. OK. They skimmed that.
Make it easy for them to skim. Most people do skim, by the way, blog content. Rarely does somebody actually read all your content word for word. So if you have bullet points, then you make it really easy to consume your content because you can have two thousand words, but you can still make it snaggle by breaking things out with headers and putting bullet points in there.
Most time that’s all they’re going to read is those bullet points. So make sure that they are important in your analytics. You can look at page scroll depth, and that is triggered by an event that we just talked about. And of course, you can create events in Google tag manager. So events are very important and it can give you a little bit more insight as to what kind of actions people took on your Web site that just a goal wouldn’t provide you.
Model Comparison Tool
One of my favorite tools in Google Analytics is to view the Model Comparison Tool. This let’s me know the value of piece of content in the sense of did they view an article and then later convert into a lead by fillout a form on a landing page.
This is also great to show the value your other campaigns are running like Social Media ads, PPC ads, organic traffic, etc. For example, if some clicks a Facebook ad and goes to your website, but doesn’t convert. Some time later they come back, but this time they arrive on your website via organic search (now that they know who you are they just tiype your brand name into Google search) and covert.
In a Last Interaction (Last click) scenario, Organic would get all of the credit. In a Linear (among other model types) partial credit goes to organic and partial credit goes to the Facebook Ad. It’s important to realzie while the Facebook Ad didn’t drive a direct conversion, it did allow to become familiar with your brand. It just may be that the timing wasn’t right for them to fillout a form at that moment.
The Linear model will tell us the Facebook Ad gets some credit for driving a conversion Last Interaction model would not have given the ad any credit.
On the other hand, you may be get a ton of traffic from a Display campaign, but no of them ever convert on the initial visitor to the website and then they never come back either. This show that Display traffic is quantity in traffic, but possesses no quality in leads or conversion.
So do people who read a blog article today come back later and convert? The Model comparison tool will assist you with this.
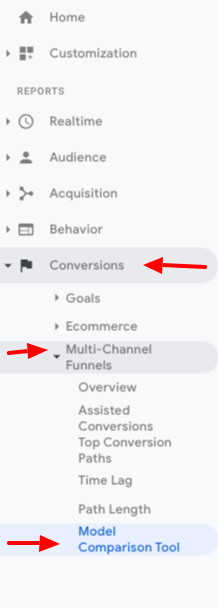
How do you get to Model Comparison tool in Google Analytics?
Conversion -> Multi-channel funnels -> Model Comparison tool
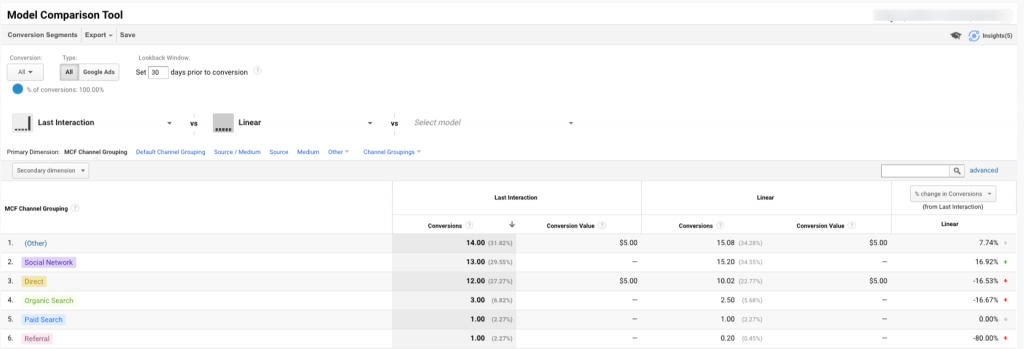
Do a model comparison:
Last Interaction vs Linear
Linear will give partial credit to each channel everytime a user comes to your website and then completes a goal (e.g. fill our a form on the website).
Chris Casale: [00:18:46] I think that one of the key things that you just talked about in the multi-touch model is why we spent so much time with podcasts ago talking about creating content for different stages of the buyer’s journey. Because the simple fact is you don’t know where individuals are that are searching your website. You don’t know where they are in their buying journey. And so having content that’s relevant to them at different stages is what’s going to convince them to make their next move.
Sample model comparison:
Rate, Review and Subscribe to the Digital Marketing Happy Hour Podcast
If you feel like you learned something of value or maybe laughed a little, would you please consider leaving a rating and review?
Finally, if you haven’t done so already, please subscribe to the podcast, so that you don’t miss another episode. It’s a seamless way to stay informed and up-to-date on digital marketing.
Have any topic ideas you’d like to learn more about or provide feedback from this episode?
Send an email to podcast@araxam.com
Subscribe
Apple, Spotify, iHeart, Stitcher or whatever podcast platform you prefer.
Recommended articles you may enjoy: