Estimated reading time: 19 minutes
If you’re running a business – or working for one – you probably understand how important it is to have reliable data. Without data, any decisions you make will be gut instincts or wild guesses. Measuring information such as the amount of sales, number of clients, website visitors, etc. can help inform your decision making.
But having the data isn’t enough. You need to be able to analyze it in a meaningful way. What does the amount of sales matter without the context of what the cost of expenses are? It’s also possible to spend too much time analyzing your numbers. The number of Android mobile users that visit the contact us page of your website from the Galapagos Islands every Tuesday from 4 – 7 PM might be interesting, but does it really help you?
It’s important to have a goal in mind before you start pouring over your data. What is it you’re trying to understand? For marketing data, you should be able to answer questions, such as:
- How are marketing activities performing today? Tomorrow?
- How do marketing efforts compare with competitor?
- What are the long-term results?
This type of information can be hard to track down, but using the right tools can really help. HubSpot is one of those tools (quite honestly, we think it’s the tool). If you’re not already familiar with them, HubSpot was founded in 2006 by Brian Halligan and Dharmesh Shah to help businesses optimize their inbound marketing. The term inbound marketing was coined by Halligan and Shah to describe the revolution occurring in marketing where businesses are helping customers find them rather than trying to find customers.
HubSpot simplifies marketing data analysis by bringing everything into one platform. Landing pages, lead nurturing emails, blogging, social media – if HubSpot doesn’t already do it, it’s likely they will before the next INBOUND conference. Honestly, we could write about all the services HubSpot offered and have enough content to fill this blog and a dozen others. However, this article will focus on the HubSpot reporting features.
Let’s get started…
How to Build a Report
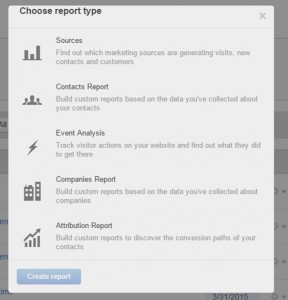
To get started, there are five types of reports in HubSpot:
- Sources – find out which marketing sources are generating visits, new contacts, and customers
- Contracts Report – build custom reports based on the data you’ve collected about your contacts
- Event Analysis – track visitor actions on your website and find out what they did to get there
- Companies Report – build custom reports based on the data you’ve collected about companies
- Attribution Report – build custom reports to discover the conversion paths of your contacts
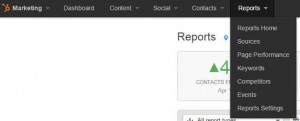
To get started, click on Reports -> Reports Home in the HubSpot dashboard menu..
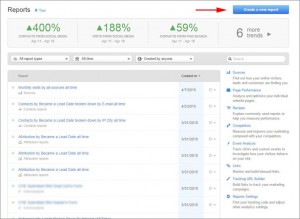
From there, you’ll be greeted with the Reports home page. Clicking the blue “Create a new report” button in the top right corner will launch the report selection dialog.
Let’s get started with the sources report.
Sources Report
The sources report helps to answer the following questions:
- How are people finding your site?
- What channels are yielding the highest conversion rates?
- Which channels are paying of (Return on Investment – ROI)?
HubSpot organizes sources into the following buckets:
- E-mail Marketing – which e-mail messages are resulting in the most clicks?
- Organic Search – what keywords are visitors using to find your website?
- Paid Search – how well are your ads performing?
- Referrals – what external sites are sending traffic your way?
- Social Media – which messages, tweets, photos, or videos are resonating with your audience?
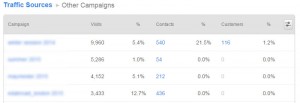
- Other Campaigns – what marketing campaigns (as defined by tracking URLs) are bringing visits to your site?
- Direct Traffic – anything that doesn’t fit into one of the above categories (this includes visitors directly typing your web address into their browser as well as those where a referral source couldn’t be found)
- Offline Sources – any contacts added to HubSpot through an imported list or the API (No included in the sources report by default)
Before we dig into the Sources Report, it’s important to understand how HubSpot handles sources:
- A contact’s traffic source is determined by the first visit NOT first conversion
Let’s walk through an example. John sees a posting on Facebook about your site and clicks the link. He’s taken to your landing page and a cookie is saved on his machine. However, John doesn’t fill out the form, so we don’t know who he is. Two weeks later, John clicks the bookmarked he saved to your landing page and fills out the form. Even though John’s second visit would be direct traffic, his source will be social media because that is how John first accessed the page.
- Customers appear in the Source Report in the time frame in which they FIRST because a contact
Using the example above, let’s assume that John filled out the form in May. After three months of lead nurturing e-mails, John becomes a customer in August. When you run a sources report, John will show up under May.
- The original source bucket can change
This is rare, but it can happen. Let’s say Sarah is on her desktop computer and gets an e-mail and clicks a link to your landing page. She doesn’t feel out a form, so we don’t know who Sarah is yet, but a cookie is saved on her machine. Three days later, Sarah is browsing Facebook on her mobile phone and sees a posting from your company. She clicks a link (again, on her phone) and comes back to the page fills out the form. Sarah’s source will be social media.Two weeks later, Sarah is back on her main computer. She gets another e-mail for a different offering on your site and fills out another form. She uses the same e-mail address that she used on her phone. Now HubSpot knows that it’s the same person and realizes that the social media bucket is wrong and updates it to e-mail marketing.
- The default time range in HubSpot’s Sources Report is “This Month to date”
- “Offline” contacts are not included in HubSpot’s Sources Report (though there is an option to include them)
And finally, a quick note on visits vs. contacts vs. customers:
- Visit – any time someone visits your website
- Contact – a visitor that has currently or previously computer a form (basically, a visitor who you have information on)
- Customer – a converted contact (i.e. a contact that has converted into a paying customer)
Once you click to create a Sources Report, you’ll get a page that looks like this:
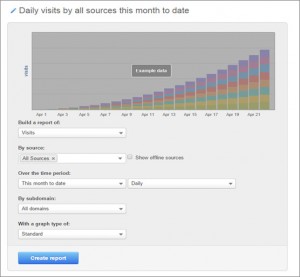
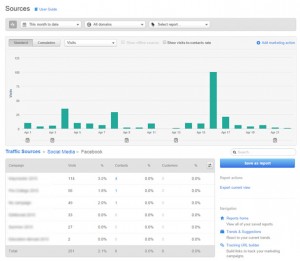
After customizing your report, clicking “Create Report” will generate a results page that will look similar to this:
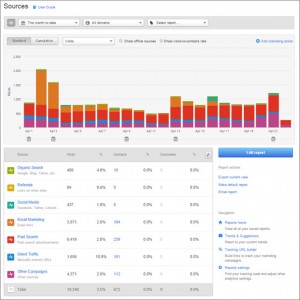
Clicking on a bucket will allow you to segment further and narrow down your results.
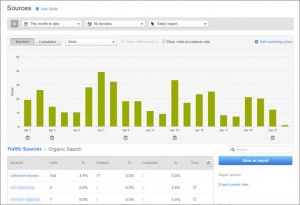
Organic Search
- Which keywords are attracting visitors?
- How are those keywords performing?
- Do you want to add the keyword to your tracking list?
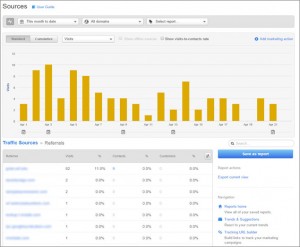
Referrals
- Which websites are linking visitors to your site?
- How well are those links performing?
Social Media
- Which social media sites are bringing visitors to your site?
- How well are each of those sites at converting visitors into contacts and customers?
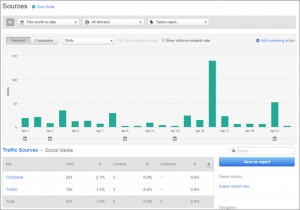
- Segment even further – view campaign performance for each social media site
E-mail Marketing
- How are campaigns performing?

- How are specific e-mails within those campaigns performing?

Paid Search
- Which campaigns are performing the best?
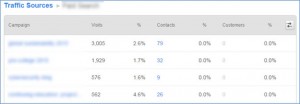
- Which keyword phrases are generating the best results within those campaigns?

Direct Traffic

Other Campaigns
Contacts Report
The contacts report helps to answer the following questions:
- Who is filling out the forms on your site?
- How much revenue have you generated by contact?
- How many contacts has a piece of content generated?
- How many contacts are in each stage of the funnel?
- View contacts based on specific properties, life cycle stage, source, industry, persona, etc.
There are four types of Contact Reports:
- Start From Scratch – customize a report to see exactly the information you want
- Contacts Revenue Last Month – understand how much revenue you have made from the contacts in your database
- Lifecycle Stage Distribution – visualize how your contacts move through the funnel over time
- Most Converting Offers – discover which offers are creating the most new leads
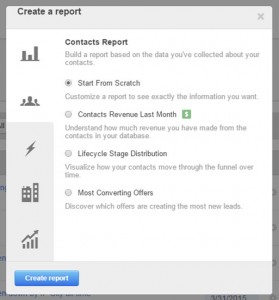
The last three of those are canned reports, but let’s take a deeper look at creating a contacts report from scratch.
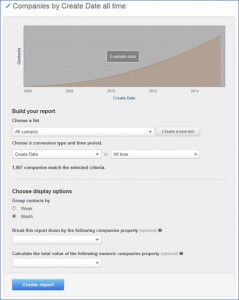
Begin by choosing the contacts you would like to report on. You can select all contacts, choose an existing list, or create a new list on the fly. Additionally, you can select the conversion type. HubSpot provides a long list of conversion types include the date the contact was created, the date is was closed, the time of first or last visit, and many more. You can also choose the time frame in which the conversion occurred (All Time, Last 30 Days, etc.)

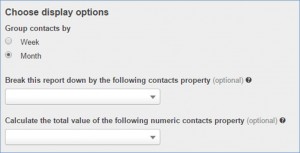
Once you select the contacts and conversion type, you must decide on whether to group contacts by week or month. You can even create the report around a specific property and calculate the value of certain properties (revenue, total pages visited, application fees, etc.)
Finally, your results will look similar to the following:
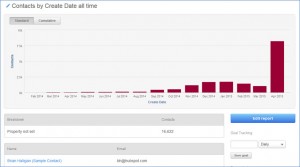
You can click on a contact to find out more information.
Event Analysis
Event analysis allows you to track when a user performs a specific action on your website. The following types of events can be tracked an analyzed:
- Visited URL – triggered when a visitor visits a specific URL
- Clicked Element – triggered when a page element is clicked
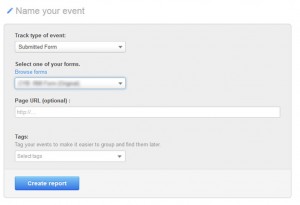
- Submitted Form – triggered when a visitor submits a form
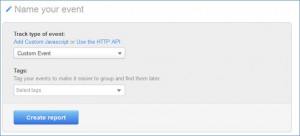
- Custom Event – triggered based on custom JavaScript or HTTP API requests
Visited URL
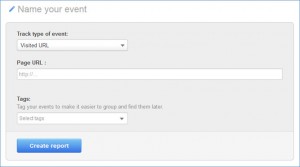
Enter a URL that, when visited, will trigger the event. You can also use wildcards to group multiple URLs.
Clicked Element
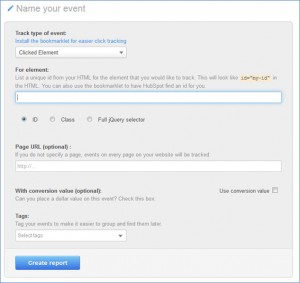
Enter the ID, class, of full jQuery selector to track a particular “click” action. This will likely require help from a web developer.
Submitted Form
Select the HubSpot form that you would like to trigger the event. You can enter the URL of a specific page to filter submissions even further.
Custom Event
Custom events require developer coordination to write custom JavaScript or API requests. These may include events such as:
- Video Payback
- Audio Playback
- Clicks (non-links)
- Mouse Tracking
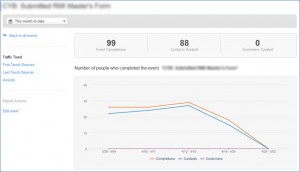
Once you decide the type of event you want to track and analyze, you’ll have a series of reports available to you.
The first is the Traffic Trend, which will show you, over time, what the trend is in the event action.
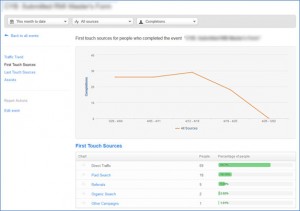
The second and third options are First and Last Touch. These allow you to review the first and/or last touches prior to the event occurring, helping you track the sources that are converting. You can segment into each bucket further too. For example, Organic Search will show you the keywords that converted.
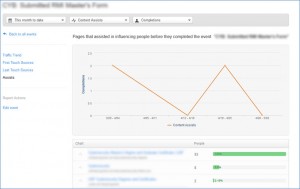
The final option is Assists, which are the pages that influenced your visitors before they completed the event.
Companies Report
The companies report will help to answer the following questions:
- How much revenue have you generated by company?
- How many customers do you have?
- What were the most popular conversion activities by company?
There are four types of company reports:
- Start From Scratch – customize a report to see exactly the information you want
- Companies Revenue Last Month – understand how much revenue you have made from the companies in your database
- Companies Revenue by Source This Year – learn which channels generate the most revenue for your business (this year)
- Companies Revenue by First Conversion – prove how much ROI your business receives from your content
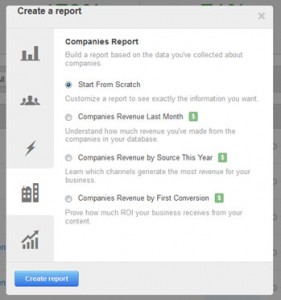
The create report screen will appear identical to the contacts report (see above):
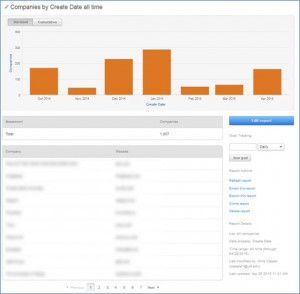
The results will look similar to the contact report as well, except the results will be a list of companies instead of contacts:
Attribution Report
The attribution report helps you understand the journey someone takes from the first time they set foot on your website to the time they become a customer. By analyzing the conversion path, you can see what contributed to a visitor “converting” into a contact. This report can help you answer questions such as:
- How many leads have you generated from your blog?
- What source is driving the most conversions?
There are four types of Attribution Reports:
- Start From Scratch – customize a report to see exactly the information you want
- Website Content & Blog Posts That Generate Leads – find out which pages your leads viewed before converting
- Most Converting Channels – trace which sources contribute the largest volume of new leads
- Frequent Pages Viewed That Generate Leads – see the last 6 pages a visitor viewed before converting into a lead with more weight on recent pages
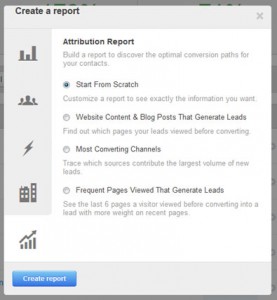
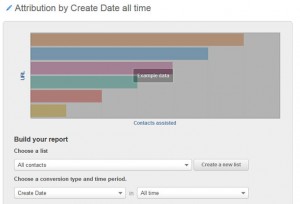
Clicking the Start From Scratch option will allow you to custom the attribution report. The first step is similar to the contacts and companies report – you will choose the list of contacts, the conversion type, and the time period.
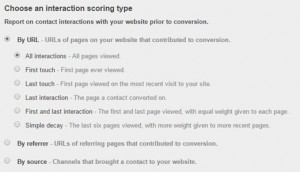
Once you’ve selected the list, you will need to choose the type of interaction scoring. You have three main choices:
- URL – the URLs of pages on your website that contributed to the conversion
- Referrer – the URLs of referring pages that contributed to the conversion
- Source – the channels that brought a contact to your website
From there, you will need to select the type:
- All Interactions – weights each touch point equally (contact and awareness stages) (not available on source)
- All Sessions – all the sources that brought a conversion (only available on source)
- First Touch – the first touch-point that converted the visitor (awareness stage)
- Last Touch – the first page viewed on the touch-point that converted the visitor (contact stage)
- Last Interaction – the last page viewed on the touch-point that converted the visitor (contact stage)
- First and Last Interaction – the first and last pages / sources that referred contacts to the site (initial interest and final conversion) (not available on source)
- Simple Decay – the last six touch-points are weighted heavier (value the last touch-points that lead to the conversion)
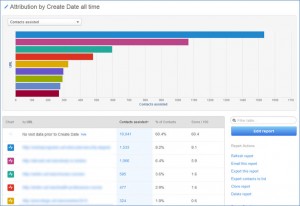
Once your selections are made, your report will look something like this:
Report Actions
In the right-hand column of the dashboard is a menu for Report Actions. These are the options that are available to every report. It’s important to make note of the first option Refresh report. After a report is generated, it will not automatically update. When you return to view the report, you must make sure to click this Refresh report option so the report re-generates with the latest data set.
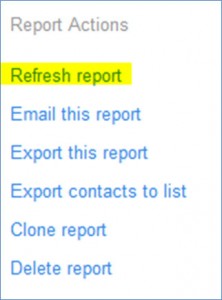
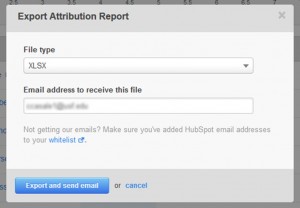
Additionally, you have the options to clone the report, delete it, as well as export and e-mail it. Exporting it will allow you to bring the data down to your desktop in the file format you desire (CSV, XLS, etc.) Just enter your e-mail address and, within a few minutes, you’ll receive an e-mail with the file in the requested format.
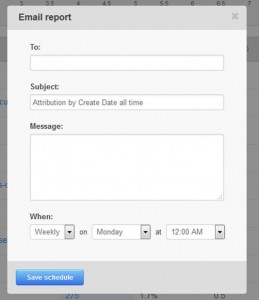
Finally, if you’d to receive regular updates, select the E-mail this report option. You can enter who should receive the e-mail, customize the subject line and message, as well as choose the e-mail schedule.
Conclusion
Inbound marketing is revolutionizing the way businesses grow and operate and HubSpot is leading the charge. Reporting is just one of their many great features. Deriving actionable insights from your marketing data allows you to make better decisions. This brief overview demonstrated just a few of these capabilities. To learn more, check out www.hubspot.com.
Recommended articles you may enjoy:


